Quality Tools – Run Charts – Part 1: Intro

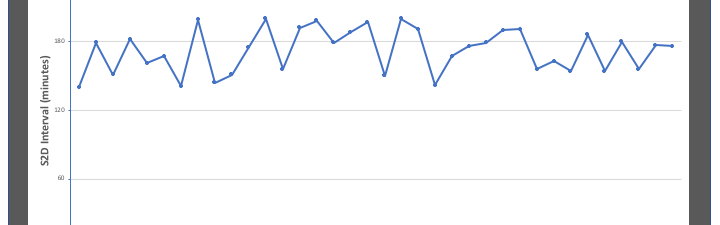
Knowing if performance is getting better, worse, or staying about the same – it can have a big impact on management decisions. The tool that helps us understand how things are going is also one of the most important data visualization tools in the quality management toolbox – the run chart. This vlog will explain… Read More

Systems Concepts – Part 2: Best Parts Do Not Make A Best System

This vlog post is the second in a series about the concept of systems. It explores the systems design principle that having all of the best individually performing parts does not nesessarily provide the best performing system. That concept is then applied to the example of systems of care for out-of-hospital cardiac arrest. (Duration –… Read More