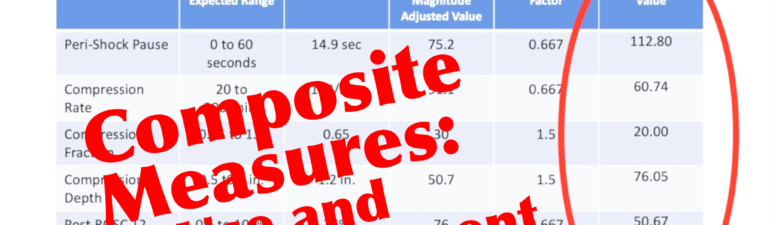
Composite measures are useful tools for summarizing groups of metrics as a single metric. This webinar shows how to build composite measures based on polarity, magnitude and weighting. The example used throughout this webinar was building a basic cardiac resuscitation performance measure consisting of five process metrics – compression rate, depth, peri-shock pause, compression fraction… Read More
Webinar – Advanced Performance Metrics: Process Capability and the Process Capability Index
This webinar illustrates how process capability indexes contrast the reality of process performance against process specifications that have both lower and upper specifications – like too slow or fast, large or small, etc. The example used in the webinar tells the story of an ad hoc improvement project team that went through several process changes… Read More
Quality Tools – Run Charts – Part 5: Outliers
This post is part 5 in our series on run charts. This one addresses the run chart rule for outliers. It defines an outlier – subjectively. The video then summarizes this five part series on run charts. (Duration = 5 min. 0 sec.) Transcript This is part 5 in our series on run charts. In… Read More
Quality Tools – Run Charts – Part 4: Runs
This post is part 4 in our series on run charts. This one addresses the run chart rule for runs. It shows how having too many or too few instances of crossing the centerline of the run chart can signal special cause variation. (Duration = 5 min. 19 sec.) Transcript This is part 4 in… Read More
Quality Tools – Run Charts – Part 3: Shifts
This post is part 3 in our series on run charts. This one addresses the run chart rule for shifts. As an example to show how to apply the run chart rule for shifts, we look at the data from an improvement project team that’s watching their time interval data as they implement a change… Read More
Quality Tools – Run Charts – Part 2: Variation and Trends
This post is part 2 in our series on run charts. In this one, we discuss how variation is present in all processes and the two types of variation we are looking for in run chart interpretation – common cause and special cause variation. The use of run chart rules to differentiate between the two… Read More
Quality Tools – Run Charts – Part 1: Intro
Knowing if performance is getting better, worse, or staying about the same – it can have a big impact on management decisions. The tool that helps us understand how things are going is also one of the most important data visualization tools in the quality management toolbox – the run chart. This vlog will explain… Read More
