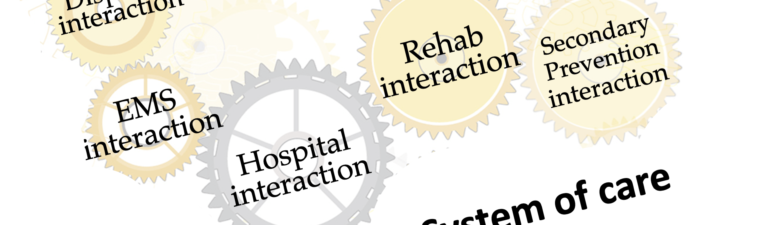
Measuring and improving performance at a systems-level has several unique challenges. In order to measure how well the system of care for a time sensitive emergency is working, we need to combine data across multiple entities. In some communities, this can get quite complex with multiple hospitals and multiple EMS agencies. It may require organizations… Read More
Webinar – EMS STEMI Alerts: Improving Accuracy
This webinar discusses EMS STEMI Alerts in systems of care. The role and importance of EMS STEMI Alerts are described. The definition of overcall and undercalls are explored followed by discussion of ways to balance them to optimize clinical quality and operational efficiency. A panel discussion with Tom Bouthillet, Tim Phalen and Mic Gunderson follows.… Read More
Benchmarking in EMS – Quality Over Coffee Series
Benchmarking provides a way to make useful comparisons between your performance and the performance of other in EMS or other industries with similar processes. Benchmarks in emergency medical services can also provide a reference for setting performance goals. This segment provides a high level description of benchmarks in emergency medical services use baselines when planning… Read More
Webinar – Clinical Specialty Teams: Team-Based Quality Model
This is the third webinar in our series on the Team-Based Quality Model. Clinical Specialty Teams are small groups of staff members who share a passion for care in a clinical area, such as, cardiac arrest, STEMI, trauma, stroke, pediatrics, or airway management. These teams are empowered by the medical director and senior management team… Read More
Webinar – Structure Your System for Quality: Team-Based Quality Model
This is the second webinar in our series on the Team-Based Quality Model. This webinar helps clarify the distinction between organizational and systems-level quality improvement efforts. It goes on to present the time sensitive care coalition model for a community or region. It seeks to create synergies between separate time sensitive care committees that might… Read More
Quality Tools – Run Charts – Part 3: Shifts
This post is part 3 in our series on run charts. This one addresses the run chart rule for shifts. As an example to show how to apply the run chart rule for shifts, we look at the data from an improvement project team that’s watching their time interval data as they implement a change… Read More
Quality Tools – Run Charts – Part 2: Variation and Trends
This post is part 2 in our series on run charts. In this one, we discuss how variation is present in all processes and the two types of variation we are looking for in run chart interpretation – common cause and special cause variation. The use of run chart rules to differentiate between the two… Read More
Quality Tools – Run Charts – Part 1: Intro
Knowing if performance is getting better, worse, or staying about the same – it can have a big impact on management decisions. The tool that helps us understand how things are going is also one of the most important data visualization tools in the quality management toolbox – the run chart. This vlog will explain… Read More
Systems Concepts – Part 2: Best Parts Do Not Make A Best System
This vlog post is the second in a series about the concept of systems. It explores the systems design principle that having all of the best individually performing parts does not nesessarily provide the best performing system. That concept is then applied to the example of systems of care for out-of-hospital cardiac arrest. (Duration –… Read More
Systems Concepts – Part 1: What is a System?
This vlog post is the first in a series about the concept of systems. We begin with a discussion of the definition of a system and introduce the idea of systems thinking. We then look at how that applies to improving clinical quality and economic efficiency in systems of care, particularly for high-risk time-sensitive conditions… Read More
