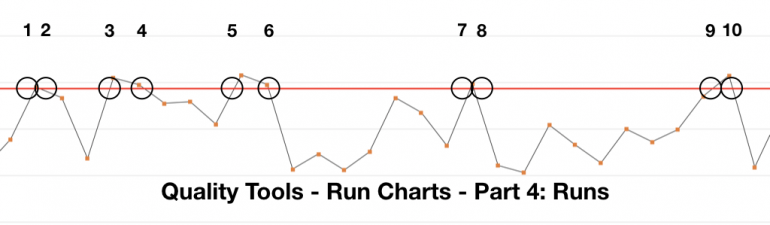
This post is part 4 in our series on run charts. This one addresses the run chart rule for runs. It shows how having too many or too few instances of crossing the centerline of the run chart can signal special cause variation. (Duration = 5 min. 19 sec.) Transcript This is part 4 in… Read More
Quality Tools – Run Charts – Part 3: Shifts
This post is part 3 in our series on run charts. This one addresses the run chart rule for shifts. As an example to show how to apply the run chart rule for shifts, we look at the data from an improvement project team that’s watching their time interval data as they implement a change… Read More
